Table of contents
About debugging and error solving
RTFM
We all like to jump in head first, and then when we fall we look up our mistakes. There is a lot of useful info at the HVCC docs that goes over some of the most important things to consider when debugging.
Read this when getting started: wasted-audio.github.io/hvcc/docs/02.getting_started.html, look at the Tips and Tricks section, and the Known Limitations.
No spaces in your files and paths, no CAPS in custom json names.
The Heavy compiler will output an error when there are spaces in the path or in the file names. This also applies to any subpatches you might use, or if you are exporting/saving your compiled patch to disk.
Do not use spaces in file names or in the paths Do not_ use capital letters in your custom components names
Daisy has its own blue screen annoying beep of death
It is not uncommon to hear a loud beep when a patch crashes.
Sometimes these crashes happen:
- Patch crashing silently, you might not be sure if didn’t upload, didn’t start, etc …
- Crash is immediate and starts the loud beep
- Patch will run for a while, even untouched, then crash seemingly random
- Doing a specific interaction like turning a knob, or turning it very fast
Debugging
First step is always to check if you have as much as possible in the ~sig / signal domain.
break your patch down into smaller pieces to find what is causing the error.
Use printing (to serial) if your in doubt of what values you’re outputting.
Read the info at HVCC docs for more general info, tips and tricks and known limitations, (un)supported items, etc.: HVCC getting started
Printing to serial instructions
To be able to read messages sent by our components we can send it to print. If you’ve done this with an Arduino you probably know the function Serial.print().
While it can be reassuring to see the results of a print message, mostly you can check the components list to see what kind of messages get sent by your knobs and such. Sometimes objects send a float sometimes a bang, consult e.g. this page at the pd2dsy GitHub to see a list.
Just like some other Plugdata blocks, like the gui sliders can be handy while you are patching, they do take up some additional program memory, so if your patch is getting too bign you could remove these. Sending to Print for example also takes up a bit of space. When no longer needed remove these.
Also don’t do this serial printing too quickly as you may fill up the print buffer and things can potentially crash.
Steps to follow:
- In Plugdata you connect your component to a print object.
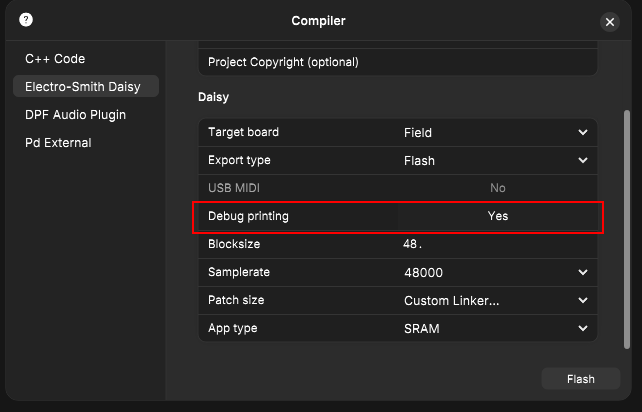
- When compiling you activate the serial debugging via USB
- connect to a serial monitor
- If you have already setup Arduino you can use it’s serial monitor.
Connect the Print object in Plugdata
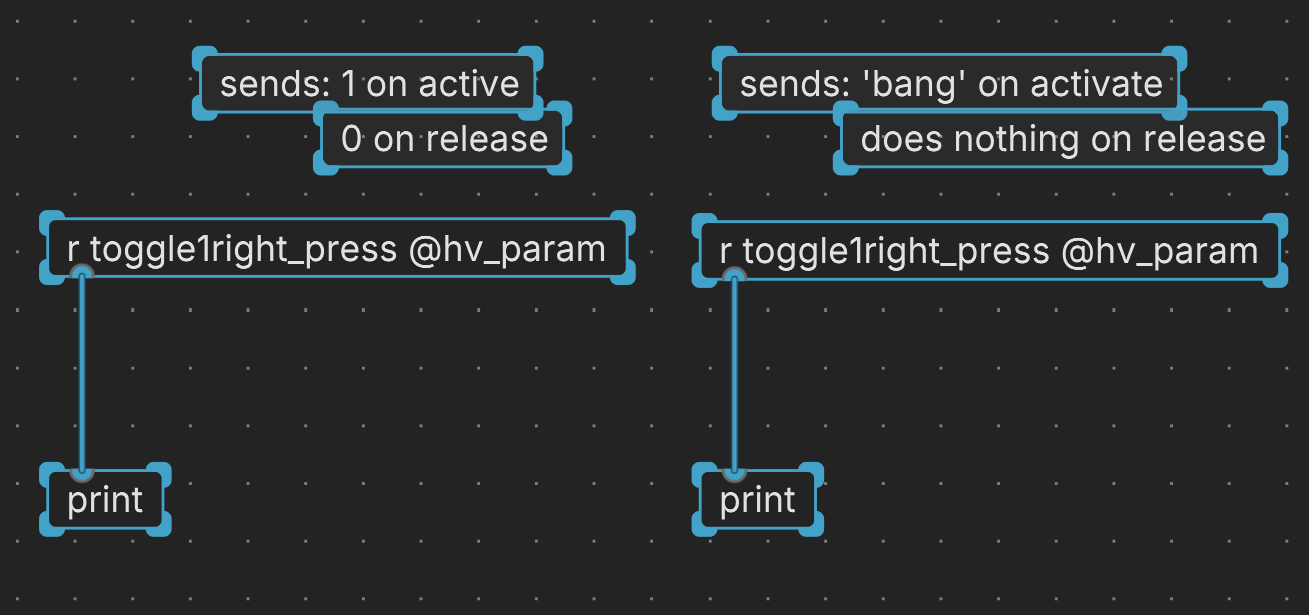
Connect the outlet of your component so you can then send messages into the [print] object.

Though we cannot read the serial output from a connected Daisy in Plugdata, the output of print inside of Plugdata can still be very useful for learning about your control flow and checking if certain actions trigger the values or bangs that you are expecting.
Connect e.g. a bng button to a print object and in the console window you’ll see the message:
print: bang.
Compiling with serial debugging
Activate Serial Debugging in the compile window before you compile and upload your patch to the Daisy.

Using a serial monitor
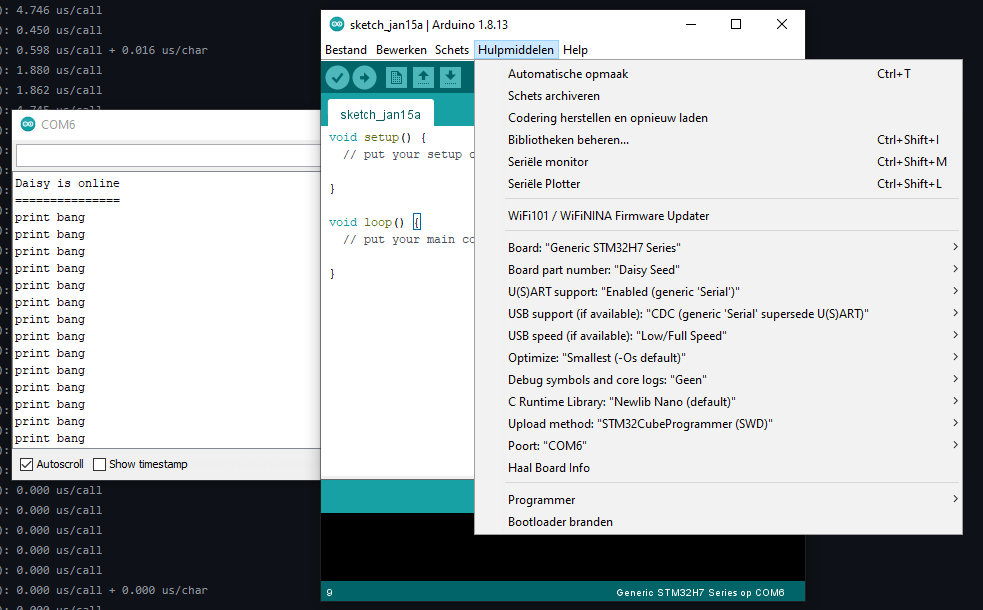
Serial monitor Arduino
If you have setup the Arduino IDE you could use the serial monitor.

I’ve also used the serial monitor on the online arduino editor.
Serial monitor via system terminal
These serial connections can of course also be read via your systems OS terminal or other applications as well. You should search something like “serial monitoring + your OS”, as it’ll differ per system.